


Primary school teachers with KCSE mean grade C (Plain) are likely to be abandoned from TSC and World Bank upgrading program.
According to a memo published by the Commission only P1 teachers with KCSE mean grade of C+ and above have been listed causing panic among teachers who had forwarded their details for consideration.
The training sponsored by the World Bank seek to instill key competencies into the teachers so that they can handle junior school classes.
In a fresh memo dated 18th September TSC want Regional and County Directors countercheck details of listed P1 teachers to ensure that their registration numbers and names sync with TSC records.
Initially had indicated that it will upgrade all P1 teachers with KCSE mean grade C plain and above with at least C+ in two teaching subjects.
Below is a memo by the Commission released this week to restart the verification process.
TEACHERS SERVICE COMMISSION
INTERNAL MEMO
TO: ALL TSC REGIONAL DIRECTORS
ALL TSC COUNTY DIRECTORS
REF: TSC/DTPM/CDS/40/VOL.III/28
DATE: 18TH SEPTEMBER, 2025
UPDATED DETAILS OF TEACHERS WHOSE NAMES WERE SUBMITTED FOR THE PROPOSED UPGRADE PROGRAMME
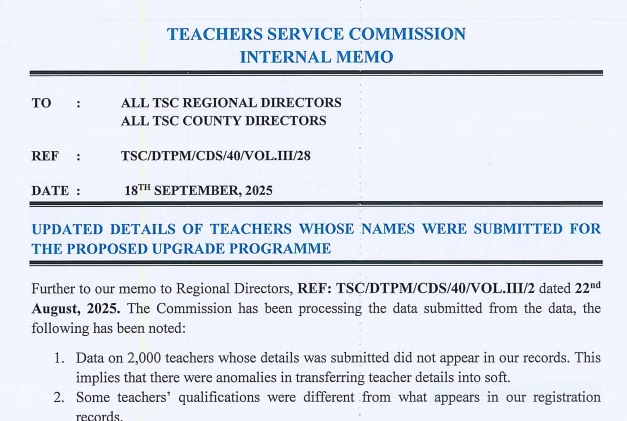
Further to our memo to Regional Directors, REF: TSC/DTPM/CDS/40/VOL.111/2 dated 22nd August, 2025. The Commission has been processing the data submitted from the data, the following has been noted:
1) Data on 2,000 teachers whose details was submitted did not appear in our records. This implies that there were anomalies in transferring teacher details into soft.
2) Some teachers’ qualifications were different from what appears in our registration records.
3) Many teachers wrote to the Commission raising their concerns that their details were not collected during the exercise.
4) There has risen a need for further information from the teachers for further processing.
Due to the aforementioned, you are required to do the following:
1) Countercheck all the details to ensure that the teachers’ registration numbers and names are as per our records.
2) Ensure that all the teachers who meet our requirements (as earlier communicated in our memo referenced above) teaching at the primary school level are not left out.
3) Add two columns so as to collect data on the KCSE Index numbers and the year the teacher sat for KCSE (See the attached template).
The purpose for this memo is to request that you immediately facilitate the collection ofthis data and share it with the undersigned for further processing using the attached template in MS Excel format so as to reach him by Wednesday, 24th September, 2025.
DR. MUGWUKU NTHAMBURI, F. AFTRA
DIRECTOR TEACHER PROFESSIONAL MANAGEMENT
Copy to: Commission Secretary
TEACHERS SERVICE COMMISSION
SERVING PI TEACHERS BY QUALIFICATION
(N/B: ENTER ONLY THE P1 TEACHERS (TEACHING GRADE 1-6) WHO ACQUIRED EITHER A KCSE MEAN GRADE OF “C” OR “C+” AND WITH A “C+” IN AT LEAST TWO SUBJECTS BUT WITHOUT A DIPLOMA OR DEGREE CERTIFICATE) COUNTY
| SINO | NAME | TSC/NO | KCSE INDEX NO. | YEAR OF SITTING FOR KCSE | SCHOOL | SUB- COUNTY | KCSE MIG | SUBJECT 1 | SUBJECT 2 | SUBJECT 3 (IF ANY) |
| 1. | ||||||||||
| 2. | ||||||||||
| 3. | ||||||||||
| 4. | ||||||||||
| 5. | ||||||||||
| 6. | ||||||||||
| 7. | ||||||||||
| 8. | ||||||||||
| 9. | ||||||||||
| 10. |
Table 1: Distribution of applicants by County and KCSE Mean grade
| S/No. | COUNTY | KCSE GRADE (A) | KCSE GRADE (A-) | KCSE GRADE (B) | KCSE GRADE (B-) | KCSE GRADE (B+) | KCSE GRADE (C+) | GRAND TOTAL |
| 1 | Makueni | 2 | 14 | 28 | 44 | |||
| 2 | Lamu | 13 | 73 | 86 | ||||
| 3 | Marsabit | 3 | 23 | 104 | 130 | |||
| 4 | Wajir | 3 | 29 | ·1 | 118 | 151 | ||
| 5 | lsiolo | 3 | 26 | 124 | 153 | |||
| 6 | Samburu | 6 | 21 | 138 | 165 | |||
| 7 | Tana-River | 7 | 38 | 1 | 169 | 215 | ||
| 8 | Mombasa | 10 | 47 | 159 | 216 | |||
| 9 | Mand era | 10 | 39 | 2 | 197 | 248 | ||
| 10 | Laikipia | 13 | 61 | 218 | 292 | |||
| 11 | Taita-Taveta | 4 | 65 | 238 | 307 | |||
| 12 | Garissa | 8 | 51 | 254 | 313 | |||
| 13 | Kirinyaga | 8 | 59 | 291 | 358 | |||
| 14 | Turkana | 17 | 75 | 277 | 369 | |||
| 15 | Embu | 5 | 107 | 2 | 367 | 481 | ||
| 16 | Kajiado | 23 | 108 | 375 | 506 | |||
| 17 | Nairobi | 24 | 94 | 2 | 398 | 518 | ||
| 18 | Tharaka-Nithi | 16 | 105 | 1 | 413 | 535 | ||
| 19 | Nyeri | 14 | 104 | 436 | 554 | |||
| 20 | Kwale | 15 | 118 | 3 | 442 | 578 | ||
| 21 | Nyamira | 26 | 132 | 476 | 634 | |||
| 22 | Elgeyo Marakwet | 1 | 10 | 156 | 2 | 479 | 648 | |
| 23 | Kilifi | 30 | 142 | 1 | 515 | 688 | ||
| 24 | Nyandarua | 25 | 186 | 2 | 480 | 693 | ||
| 25 | Baringo | 12 | 170 | 2 | 515 | 699 | ||
| 26 | West Pokot | 27 | 190 | 1 | 558 | 776 | ||
| 27 | Uasin Gishu | 24 | 193 | 598 | 815 | |||
| 28 | Vihiga | 40 | 244 | 579 | 863 | |||
| 29 | Kiambu | 22 | 186 | 671 | 879 | |||
| 30 | Busi a | 1 | 51 | 262 | 3 | 633 | 950 | |
| 31 | Trans Nzoia | 47 | 255 | 703 | 1005 | |||
| 32 | Kisii | 36 | 242 | 1 | 727 | 1006 | ||
| 33 | Kitui | 79 | 270 | 2 | 663 | 1014 | ||
| 34 | Kericho | 36 | 270 | 1 | 722 | 1029 | ||
| 35 | Bo met | 57 | 271 | 733 | 1061 | |||
| 36 | Nandi | 51 | 206 | 4 | 840 | 1101 | ||
| 37 | Machakos | 58 | 323 | 1 | 749 | 1131 | ||
| 38 | Narok | 46 | 300 | 804 | 1150 | |||
| 39 | Meru | 47 | 300 | 3 | 909 | 1259 |
| 40 | Migori | 97 | 377 | 2 | 882 | 1358 | ||
| 41 | Siaya | 114 | 389 | 5 | 882 | 1390 | ||
| 42 | Muranga | 36 | 250 | 1124 | 1410 | |||
| 43 | Kisumu | 10·2 | 406 | 3 | 945 | 1456 | ||
| 44 | Homa-Bay | 100 | 438 | 1 | 1027 | 1566 | ||
| 45 | Nakuru | 69 | 443 | 3 | 1157 | 1672 | ||
| 46 | Bungoma | 13·g | 657 | 8 | 1405 | 2208 | ||
| 47 | Kakamega | 4 | 243 | 1243 | 6 | 2673 | 4169 | |
| Grand Total | 1 | 5 | 1814 | 9698 | 63 | 27268 | 38849 |